knitr::opts_chunk$set(echo = TRUE)
# import the libraries needed
library(igraph)
library(ggraph) # If you get an error run install.packages('ggraph')
library(tidygraph) # If you get an error run install.packages('tidygraph')
library(readxl) # If you get an error run install.packages('tidyverse')
set_graph_style(family='sans')
This is an old version of the class, kept for posterity. If you're seeing this, you probably want to check the URL and go to the latest version.
Creating Networks
This first cell is setup code. It loads a bunch of libraries that we will use later on, so you will need to run this cell before your run any other cells. If you get an error, then you may need to install the libraries. See Lab 1 for instructions on how to do that.
The goal
The goal of this assignment is very simple - learn how to create a network in R.
We will talk about three main ways to do this, but we will start with the hardest first.
Networks from two spreadsheets
I think it’s really useful to think of networks as two spreadsheets. The first spreadsheet is a list of edges and their attributes (a.k.a. an edgelist) and the second is a list of nodes and their attributes.
We’ll start by creating a simple edgelist, using made up names.
Exercise
In Excel (or LibreOffice or Google Sheets) open a new spreadsheet, and create a spreadsheet that looks like this:
| From | To |
|---|---|
| John | Ida |
| Elwyn | Ida |
| Okan | Axelle |
| John | Axelle |
| Axelle | Ida |
Save the spreadsheet to your computer as an XLSX file called edges.xlsx; make sure to save it to the same folder as this file.
Uncomment the code below (by deleting the # symbol) and run it.
edgelist <- read_excel("/home/jeremy/Teaching/can-s25.jeremydfoote.com/assignments/r_lab_examples/edges.xlsx")Look down at the R console (the bottom window) and see if it worked. You might get an error here that says something like there is no function called 'readxl'. If you get that, then you need to run install.packages('tidyverse') in the console (this is in the bottom window). It will take a while to install, but if it works correctly your code above should work.
You may also get an error that’s something like could not find function "read_excel". If you get that, then you need to run the cell at the top of this page (the one that starts with knitr::opts_chunk$set(echo = TRUE)). This will load the libraries that we need to run the rest of the code.
Finally, you might get an error that says something like Error: path does not exist: ‘./edges.xlsx’. This means that R can’t find the file. Make sure that you saved the file to the same folder as this file. If you need to, you can right-click the filename and select Copy Path to get the full path to the file. Replace ./edges.xlsx with the full path.
To test if everything worked right, uncomment the following code to show all of the edges in R.
edgelist# A tibble: 5 × 2
From To
<chr> <chr>
1 John Ida
2 Elwyn Ida
3 Okan Axelle
4 John Axelle
5 Axelle Ida (Note: the “#” symbol “comments out” code - this means that anything after the # in a given line will be ignored by R)
Excercise
Next, we will create a table of attributes for the people in our network, and import that, too.
Do the same thing again - open a new spreadsheet, and this time make it look like this:
| Name | Age | Gender | Major |
|---|---|---|---|
| John | 22 | M | COM |
| Elwyn | 23 | M | SOC |
| Okan | 25 | F | COM |
| Ida | 19 | F | SOC |
| Axelle | 20 | T | COM |
Make sure that the spelling (including capitalization) is the same as in your edgelist file.
Again, save it to this folder, as node_atts.xlsx.
Here is my import code, which should work if you saved it to this folder:
node_atts <- read_excel("/home/jeremy/Teaching/can-s25.jeremydfoote.com/assignments/r_lab_examples/node_atts.xlsx")Uncomment and run the following code to check that it worked.
node_atts# A tibble: 5 × 4
Name Age Gender Major
<chr> <dbl> <chr> <chr>
1 John 22 M COM
2 Elwyn 23 M SOC
3 Okan 25 F COM
4 Ida 19 F SOC
5 Axelle 20 T COM Importing into R
Finally, we’ll create a network “object” using these files. So far, what we’ve done is take our two spreadsheets, converted them into a format that R can understand (called a tibble), and saved them as the variables edgelist and node_atts. Creating a network objects tells R that these represent a network, so that it can create visualizations, get network statistics, etc.
We do this by running graph_from_data_frame. This is a function that takes in the arguments d, vertices, and directed.
dis the edgelistverticesis the node attributesdirectedis whether this is a directed or undirected graph.
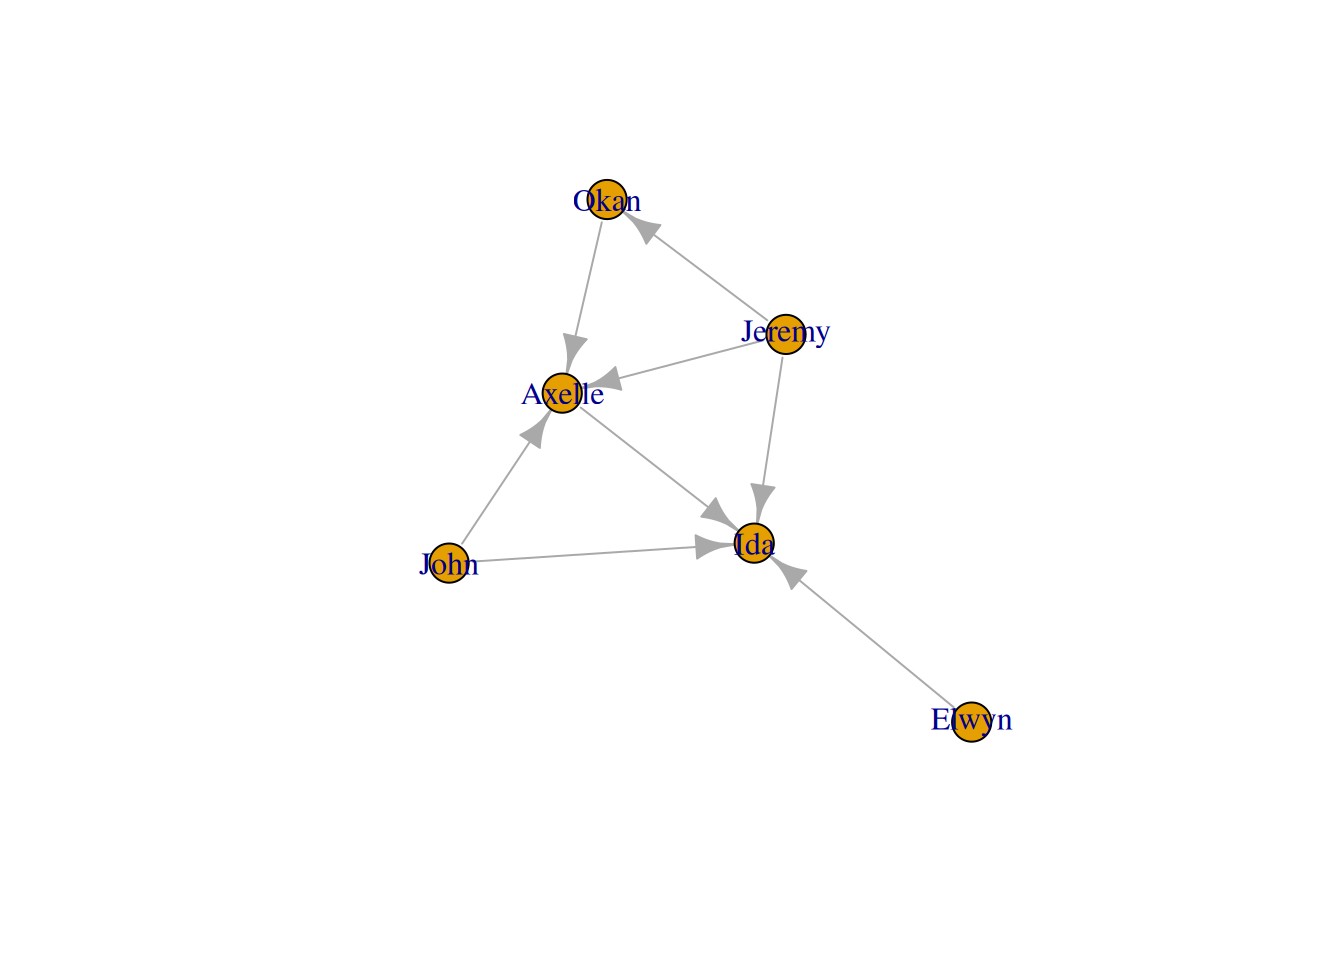
If you’ve done everything right, then when you uncomment the code below, it should produce a network plot.
G <- graph_from_data_frame(d = edgelist,
                           vertices = node_atts, directed = T)
plot(G)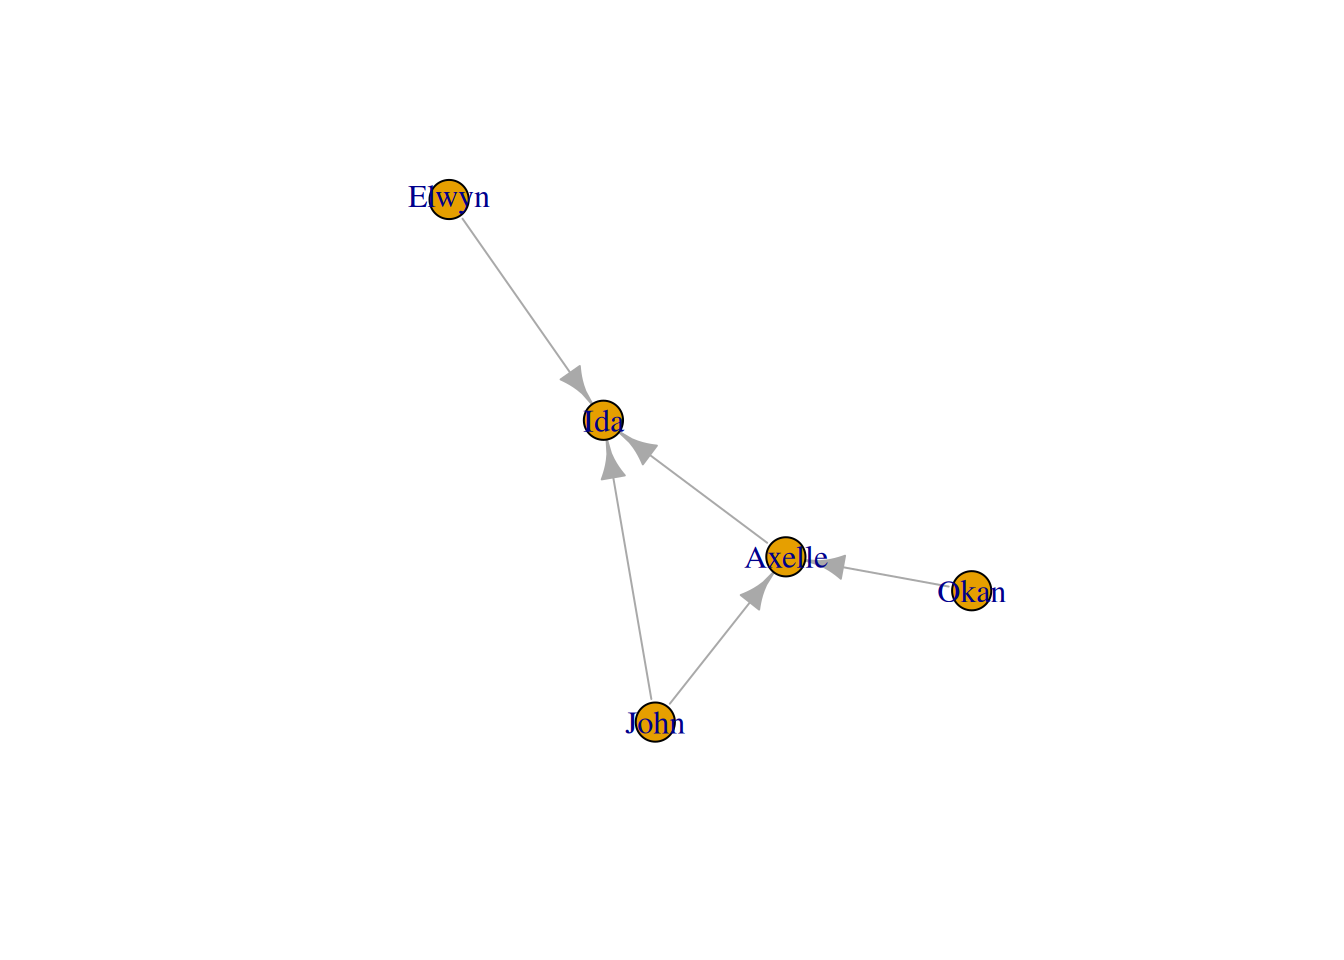
The one piece of code from above that we haven’t talked about is G <-. This saves the network to the variable G and then plot(G) makes a basic plot of it.
If this doesn’t work, the most likely culprit is a typo in either the edgelist or the node attributes. Check the spelling and capitalization of the names in both files.
Tidygraph networks
Finally, to make things even more confusing, for lots of the cool things we’ll be doing in future lessons, we need to take one more step, and turn this from a normal network object into a tidygraph network object.
To do this, we take G (the network object we just created) and run as_tbl_graph() on it.
Uncomment the code below and run it. If it worked, then you should see a text output with two tables:
Node Data and Edge Data
G <- as_tbl_graph(G)

G
# A tbl_graph: 5 nodes and 5 edges
#
# A directed acyclic simple graph with 1 component
#
# Node Data: 5 × 4 (active)
name Age Gender Major
<chr> <dbl> <chr> <chr>
1 John 22 M COM
2 Elwyn 23 M SOC
3 Okan 25 F COM
4 Ida 19 F SOC
5 Axelle 20 T COM
#
# Edge Data: 5 × 2
from to
<int> <int>
1 1 4
2 2 4
3 3 5
# ℹ 2 more rowsLoading data from R packages
Now that you’ve learned the hardest way to load network data, let’s learn a few easier ways. One is by loading it from pre-created packages. One of the biggest, fairly straightforward packages is called networkdata.
Unfortunately, it’s a little bit trickier to install this package than other packages. You will need to run install.packages("remotes") in the terminal (the bottom pane), and when that is done run remotes::install_github("schochastics/networkdata"), also in the terminal.
If it works, then you should be able to load the package when you uncomment the code below.
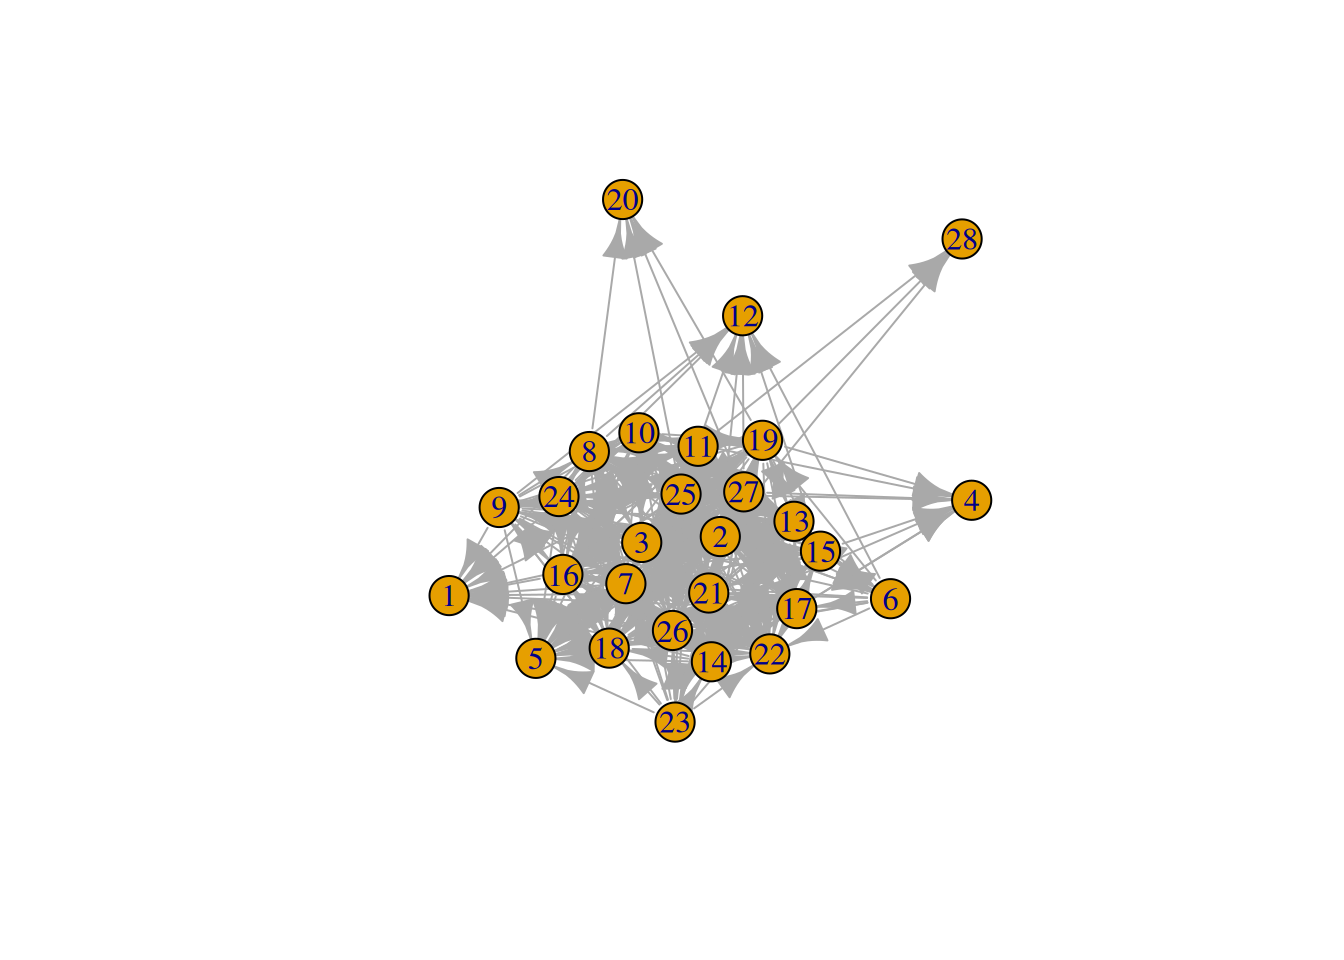
library(networkdata)Now, you will have access to the networks from the package. Run data(package='networkdata') to see all of the options. This code shows an advice network from a high-tech firm:
# This code turns the ht_advice network object into a tidygraph object, and saves it as G
G <- as_tbl_graph(ht_advice)
plot(G)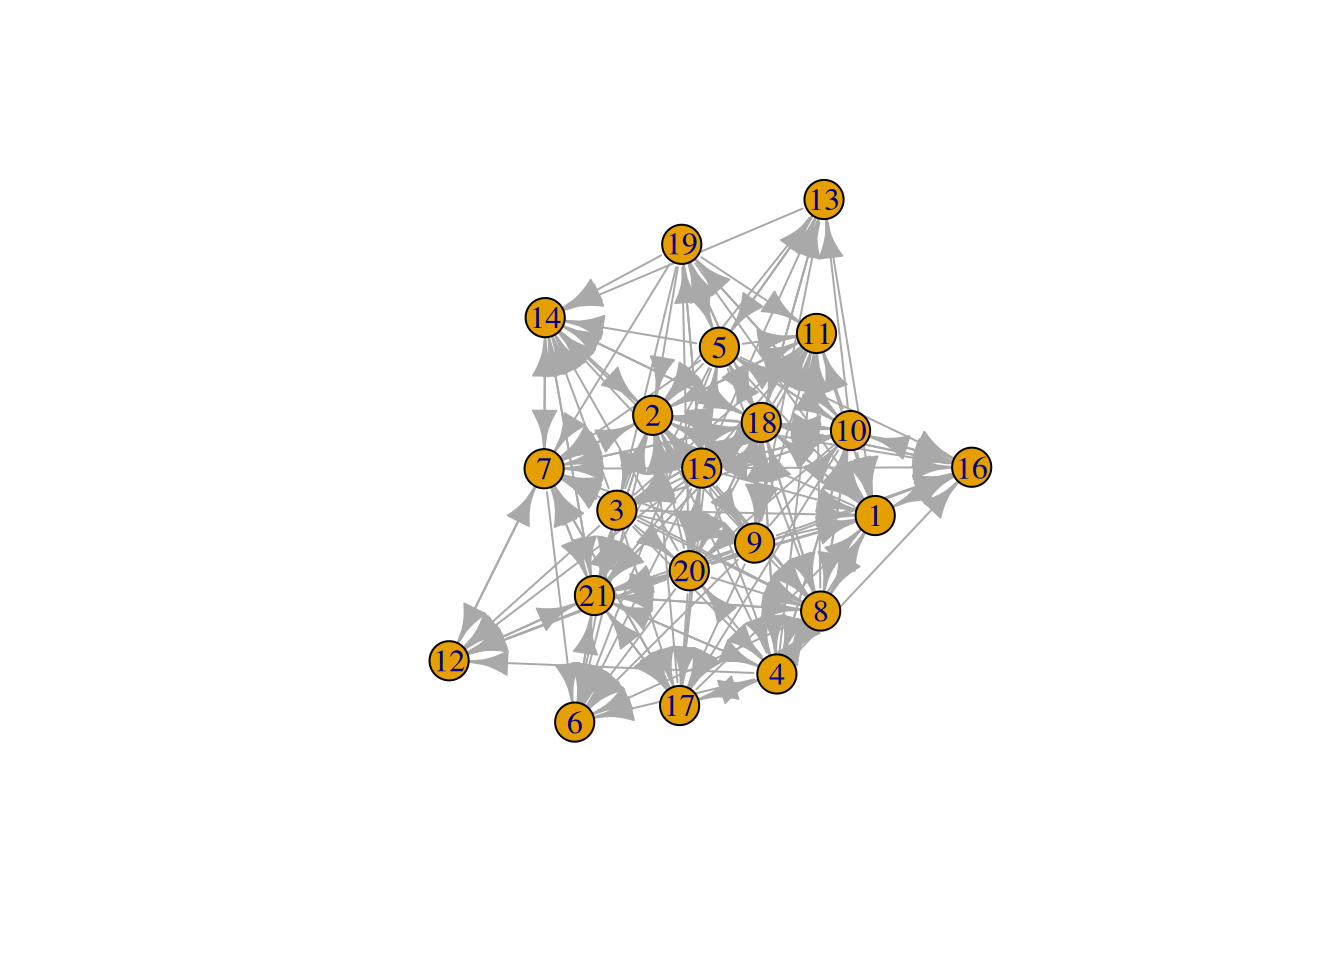
Random networks
Finally(!), the last thing you can do is to create random networks in R. There are a ton of options, so I’ll just show you one.
This is a Erdos-Renyi graph, where each edge is created randomly.
G = play_gnp(20, .4)

plot(G)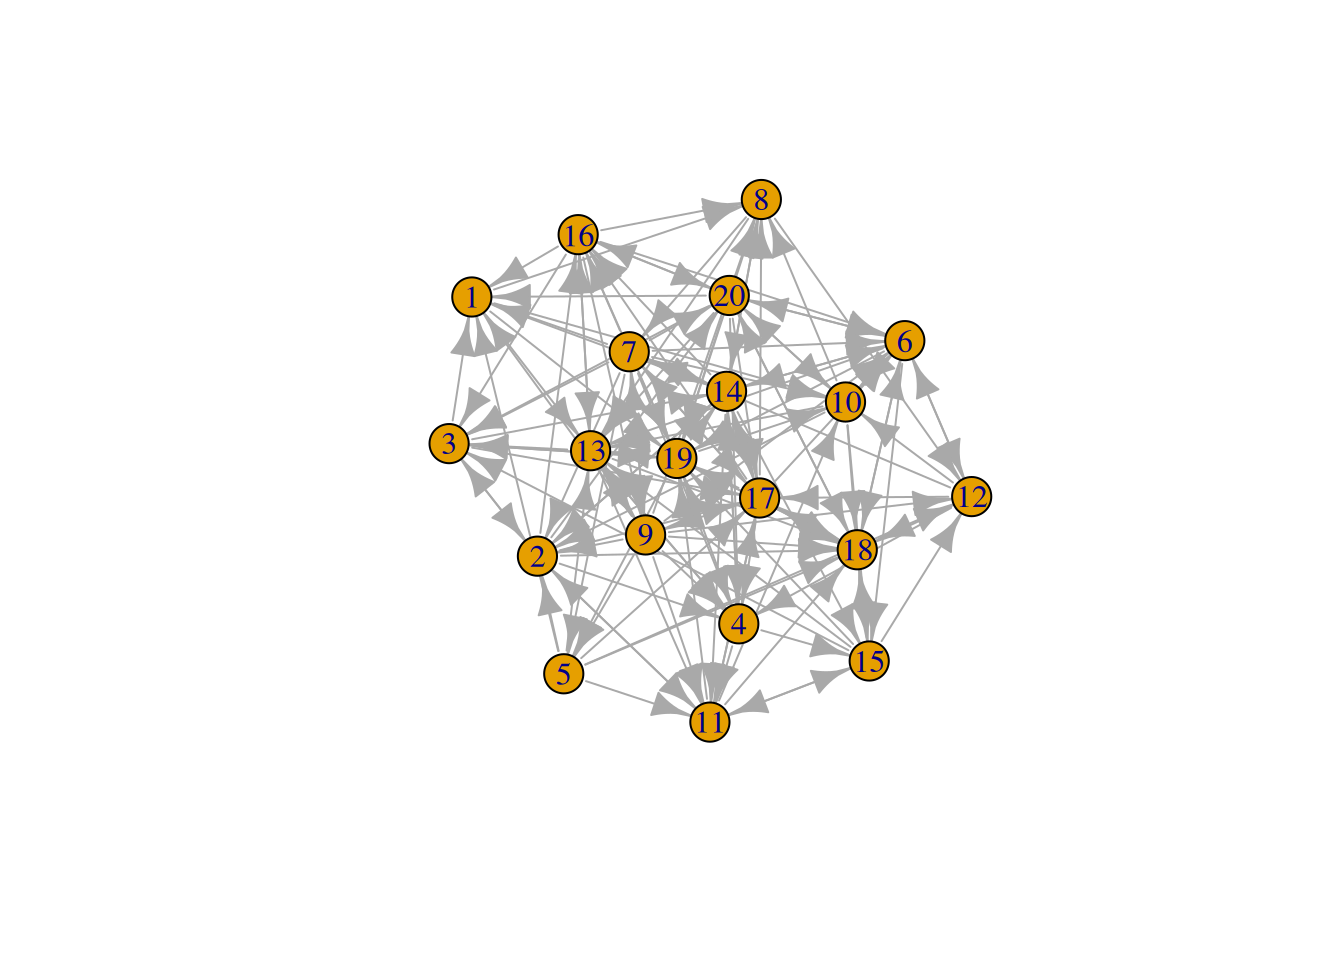
Exercises
- See if you can figure out how to add another person to the network you created, following all of the steps above. Do this by creating new spreadsheets in Excel, something like
edgelist_2.xlsxandnode_atts_2.xlsx. Make sure to give the new person node attributes and at least one edge. Usegraph_from_data_frameto create a new network object andas_tbl_graphto change it into atidygraphnetwork object.
Finally, create a new network plot with the new person.
- Above, we loaded the
ht_advicenetwork. Figure out how to load theffe_elitenetwork fromnewtorkdataas atidygraphobject, and plot it.
- The
play_gnp()function above has two parameters, which have the values20and.4. Try changing the values and observing the result. What do you think each of these parameters do?
YOUR ANSWER HERE
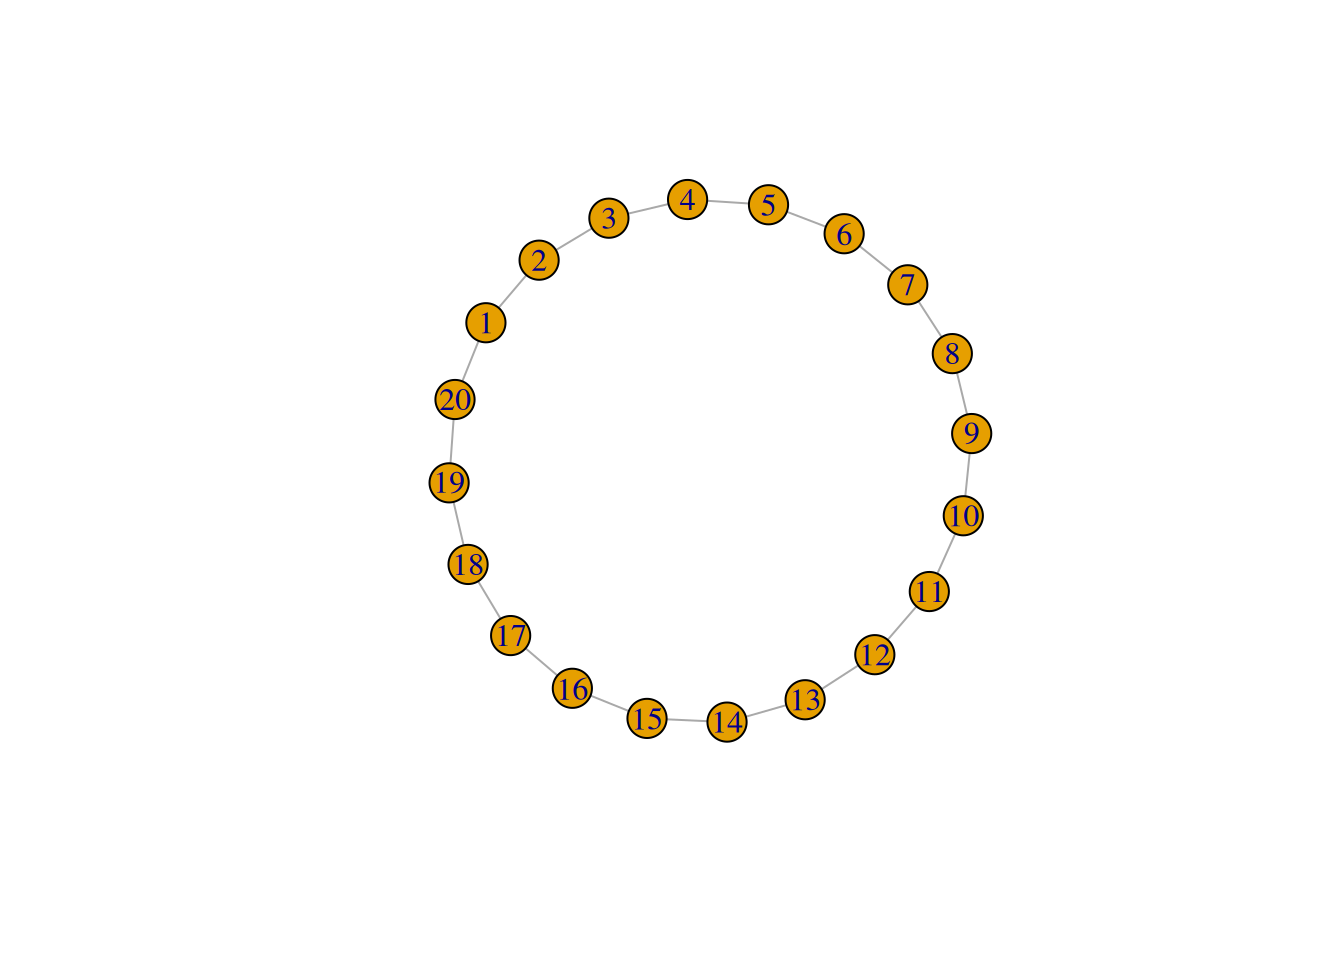
- A list of a bunch of possible random graphs is listed at https://tidygraph.data-imaginist.com/reference/index.html under “Graph Creation”. See if you can figure out how to make a ring graph with 20 nodes.